
Why the Cheapest Lead Is Usually the Most Expensive Decision You'll Make
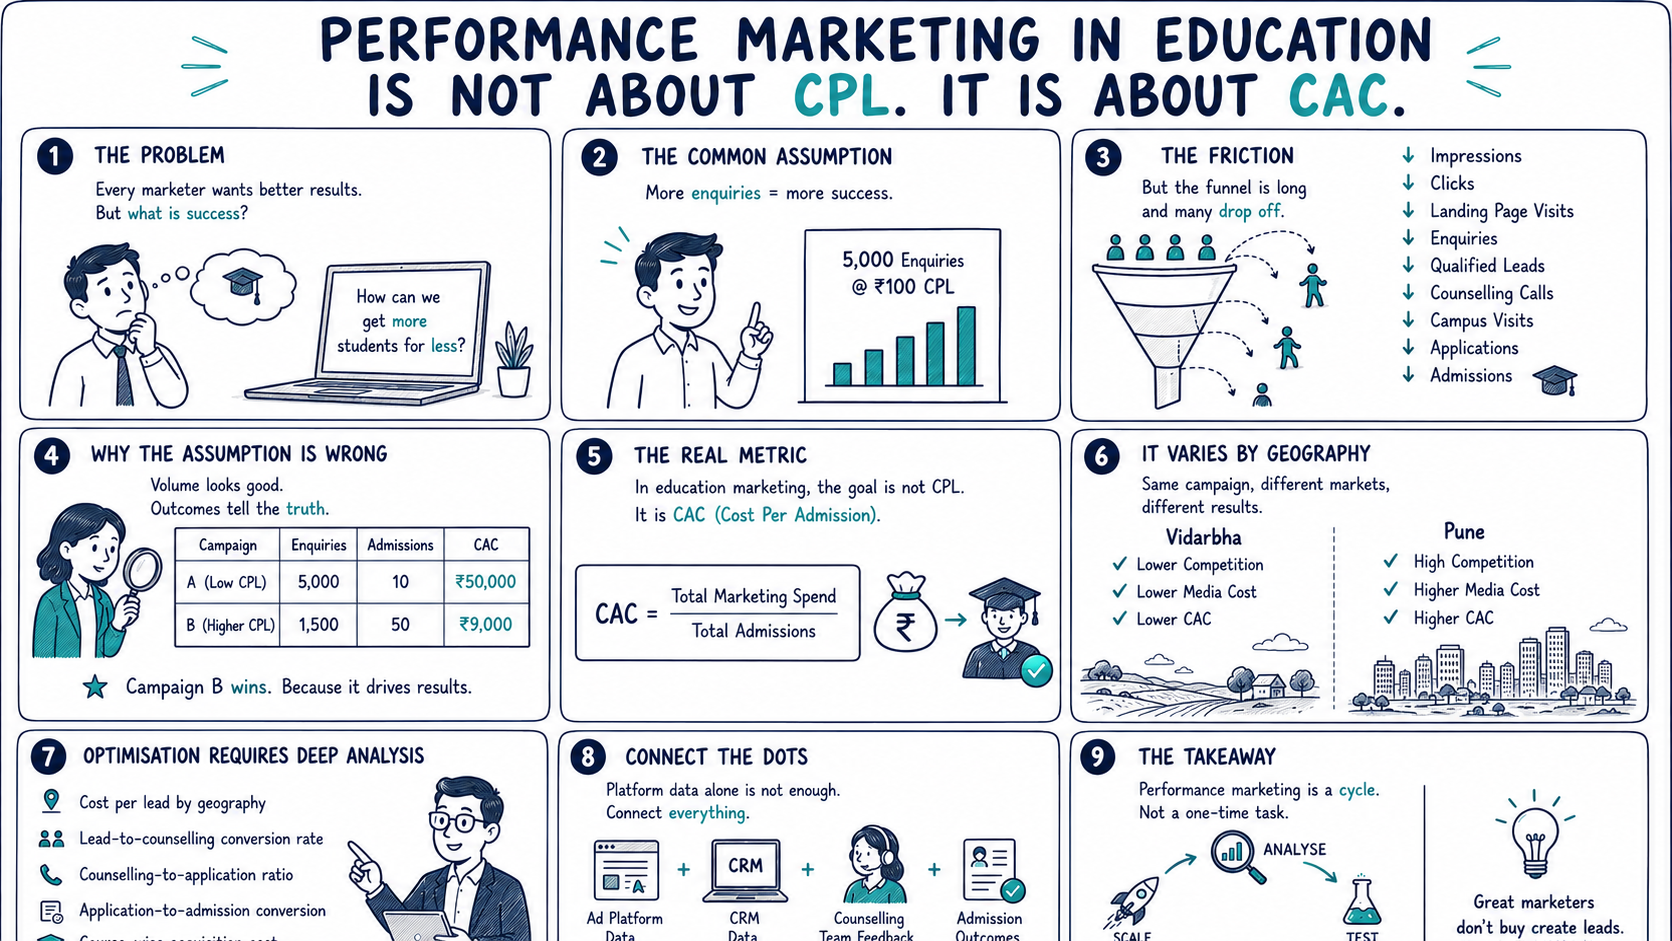
Two admission campaigns sat side by side on a review dashboard. One had generated 5,000 enquiries at ₹100 per lead. The other had generated 1,500 enquiries at ₹300 per lead — three times the cost, a third of the volume. On paper, the choice looked obvious, and I've sat in enough of these reviews to know which campaign usually gets applauded in the room.
Then the counselling and admission numbers came in. The ₹100 campaign converted 10 students. The ₹300 campaign converted 50. The "expensive" campaign had actually acquired each admitted student for a fraction of what the "cheap" one cost — and if the review had stopped at the CPL dashboard, nobody would have known.
The Metric Everyone Tracks Isn't the Metric That Matters
Cost Per Lead is one of the most commonly tracked numbers in education marketing, and it's easy to see why — it's available instantly, it's easy to report weekly, and it's directly controllable through media buying. Cost Per Admission, the number that actually reflects whether the campaign worked, sits at the far end of a much longer chain: impressions, clicks, landing page visits, enquiries, qualified leads, counselling calls, campus visits, applications, and finally admissions. It takes weeks to know, depends on teams outside marketing, and can't be optimised from an ad dashboard alone.
That gap in timing and visibility is not a small technical detail. It's the entire reason CPL keeps getting treated as the objective when it was only ever meant to be a checkpoint along the way to one.
The Hidden Pattern: Organisations Optimise What's Easy to Measure Early, Not What Actually Matters Late
This isn't a marketing-skill problem. It's a structural one. Any metric that arrives early in a funnel is inherently easier to report, easier to influence, and easier to feel good about in a weekly review — regardless of whether it's the metric the business actually needs. A campaign manager judged on CPL will rationally optimise for CPL, because that's the number visible to them in real time. The connection to actual admissions, sitting weeks downstream and dependent on counselling quality, institutional fit, and course-level demand, is invisible from inside the ad platform.
The result is a quiet substitution: a leading indicator that's easy to move stands in for a lagging indicator that's hard to measure, and over time the organisation starts managing the proxy as if it were the goal.
Where Geography and Lead Quality Complicate the Picture Further
Even Cost Per Admission isn't uniform enough to optimise as a single number. In a market like Vidarbha, where competition intensity and media costs run lower, acquisition costs behave very differently than in a market like Pune, where multiple institutions are bidding for the same student pool. A campaign that looks efficient nationally can be quietly underperforming in the one region driving most of the spend — which is why the real analysis has to run region by region: cost per lead by geography, lead-to-counselling conversion, counselling-to-application ratio, application-to-admission conversion, course-wise acquisition cost, and channel-wise performance.
Lead volume compounds the same trap. High-volume platforms can generate enquiries efficiently without generating intent, which means campaign optimisation can't stop at the ad dashboard. It has to connect ad platform data with CRM records, counselling team feedback, and actual admission outcomes before anyone can say with confidence which audiences, creatives, and campaigns are genuinely contributing to enrolments rather than just enquiries.
This Pattern Repeats Everywhere a Funnel Has a Long Tail
The same substitution shows up in any business where the metric that's easy to measure sits far upstream of the metric that pays the bills. SaaS teams optimise for Marketing Qualified Leads while the business is actually funded by paying, retained customers months later. E-commerce teams optimise click-through rate while the business depends on customer lifetime value. Specialty chemical sales teams can chase inquiry volume while contract value and repeat orders are what determine whether the quarter was actually good. In every case, the number that's visible on a Monday morning dashboard and the number that determines whether the business grew are not the same number — and the gap between them is exactly where budgets get misallocated.
What This Changes
The practical shift isn't abandoning CPL — it's still a useful early signal. The shift is refusing to let it stand in as the definition of success on its own. The better discipline is treating the full chain — Analyse, Test, Learn, Scale, Measure Business Impact — as one continuous cycle, where every upstream number is judged only by how well it predicts the downstream one it's supposed to represent.
The best performance marketers were never the ones generating the cheapest leads. They're the ones who can tell you, with data, exactly which leads quietly became the business's real revenue — and which ones just made a dashboard look good for a week.